6. Plotting tools

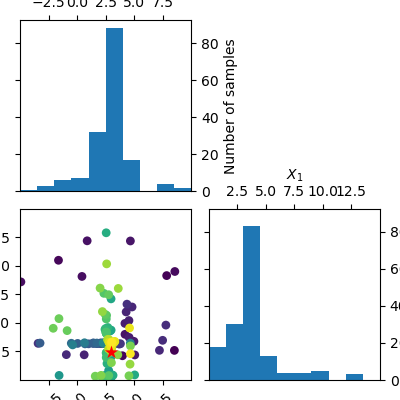
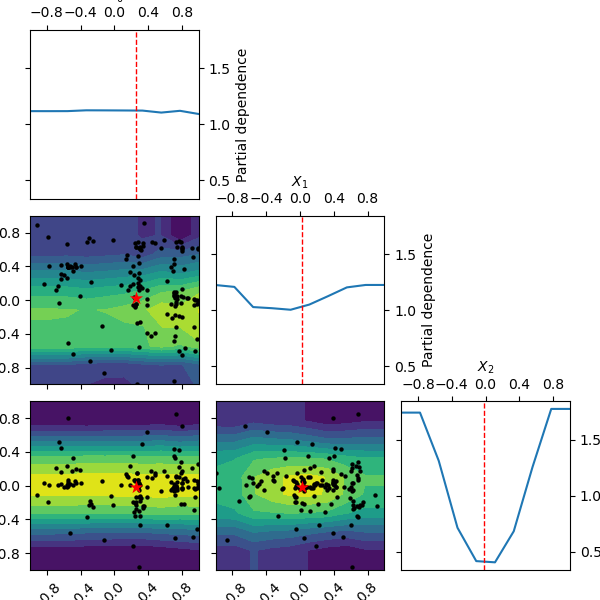
Plotting functions can be used to visualize the optimization process.
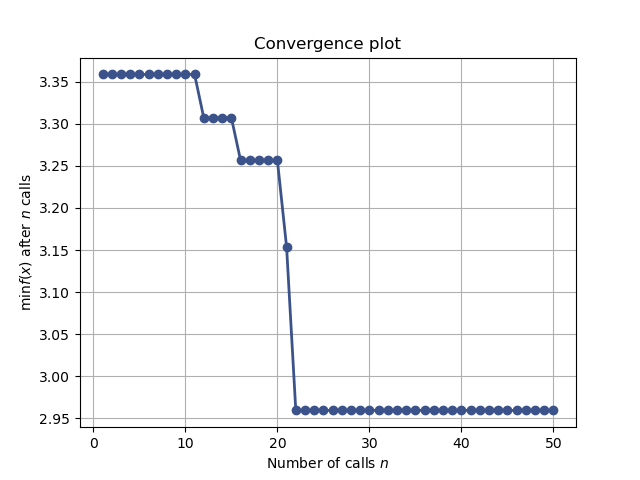
6.1. plot_convergence

plot_convergence plots one or several convergence traces.

../_images/sphx_glr_hyperparameter-optimization_0011.png

6.2. plot_evaluations

plot_evaluations visualize the order in which points where sampled.

../_images/sphx_glr_visualizing-results_0021.png

6.3. plot_objective

plot_objective creates pairwise dependence plot of the objective function.

../_images/sphx_glr_partial-dependence-plot_0011.png

6.4. plot_regret

plot_regret plot one or several cumulative regret traces.