skopt.plots.plot_gaussian_process
-
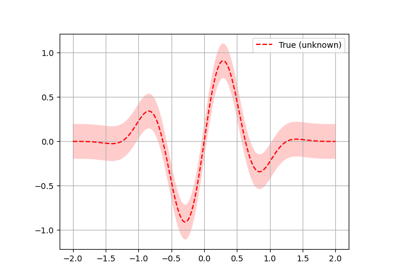
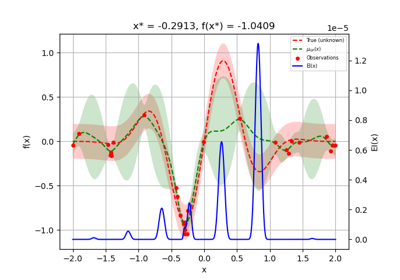
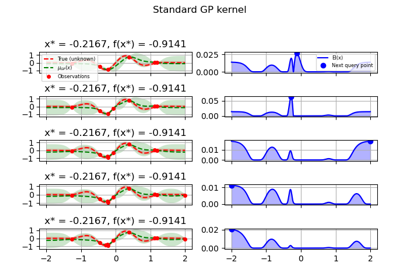
skopt.plots.plot_gaussian_process(res, **kwargs)[source][source]¶ Plots the optimization results and the gaussian process for 1-D objective functions.
- Parameters
- res
OptimizeResult The result for which to plot the gaussian process.
- ax
Axes, optional The matplotlib axes on which to draw the plot, or
Noneto create a new one.- n_callsint, default: -1
Can be used to evaluate the model at call
n_calls.- objectivefunc, default: None
Defines the true objective function. Must have one input parameter.
- n_pointsint, default: 1000
Number of data points used to create the plots
- noise_levelfloat, default: 0
Sets the estimated noise level
- show_legendboolean, default: True
When True, a legend is plotted.
- show_titleboolean, default: True
When True, a title containing the found minimum value is shown
- show_acq_funcboolean, default: False
When True, the acquisition function is plotted
- show_next_pointboolean, default: False
When True, the next evaluated point is plotted
- show_observationsboolean, default: True
When True, observations are plotted as dots.
- show_muboolean, default: True
When True, the predicted model is shown.
- res
- Returns
- ax
Axes The matplotlib axes.
- ax