skopt.plots.plot_objective
-
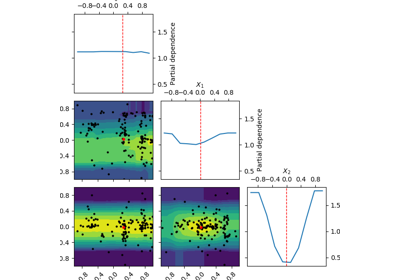
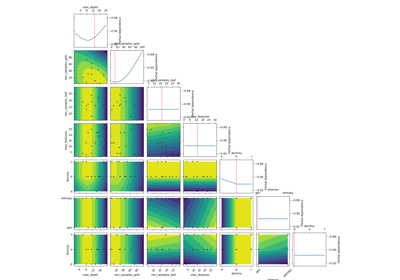
skopt.plots.plot_objective(result, levels=10, n_points=40, n_samples=250, size=2, zscale='linear', dimensions=None, sample_source='random', minimum='result', n_minimum_search=None)[source][source]¶ Pairwise dependence plot of the objective function.
The diagonal shows the partial dependence for dimension
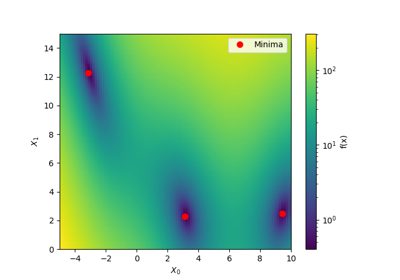
iwith respect to the objective function. The off-diagonal shows the partial dependence for dimensionsiandjwith respect to the objective function. The objective function is approximated byresult.model.Pairwise scatter plots of the points at which the objective function was directly evaluated are shown on the off-diagonal. A red point indicates per default the best observed minimum, but this can be changed by changing argument ´minimum´.
- Parameters
- result
OptimizeResult The result for which to create the scatter plot matrix.
- levelsint, default=10
Number of levels to draw on the contour plot, passed directly to
plt.contour().- n_pointsint, default=40
Number of points at which to evaluate the partial dependence along each dimension.
- n_samplesint, default=250
Number of samples to use for averaging the model function at each of the
n_pointswhensample_methodis set to ‘random’.- sizefloat, default=2
Height (in inches) of each facet.
- zscalestr, default=’linear’
Scale to use for the z axis of the contour plots. Either ‘linear’ or ‘log’.
- dimensionslist of str, default=None
Labels of the dimension variables.
Nonedefaults tospace.dimensions[i].name, or if alsoNoneto['X_0', 'X_1', ..].- sample_sourcestr or list of floats, default=’random’
Defines to samples generation to use for averaging the model function at each of the
n_points.A partial dependence plot is only generated, when
sample_sourceis set to ‘random’ andn_samplesis sufficient.sample_sourcecan also be a list of floats, which is then used for averaging.Valid strings:
‘random’ -
n_samplesrandom samples will used‘result’ - Use only the best observed parameters
- ‘expected_minimum’ - Parameters that gives the best
minimum Calculated using scipy’s minimize method. This method currently does not work with categorical values.
- ‘expected_minimum_random’ - Parameters that gives the
best minimum when using naive random sampling. Works with categorical values.
- minimumstr or list of floats, default = ‘result’
Defines the values for the red points in the plots. Valid strings:
‘result’ - Use best observed parameters
- ‘expected_minimum’ - Parameters that gives the best
minimum Calculated using scipy’s minimize method. This method currently does not work with categorical values.
- ‘expected_minimum_random’ - Parameters that gives the
best minimum when using naive random sampling. Works with categorical values
- n_minimum_searchint, default = None
Determines how many points should be evaluated to find the minimum when using ‘expected_minimum’ or ‘expected_minimum_random’. Parameter is used when
sample_sourceand/orminimumis set to ‘expected_minimum’ or ‘expected_minimum_random’.
- result
- Returns
- ax
Axes The matplotlib axes.
- ax