skopt.plots.plot_evaluations
-
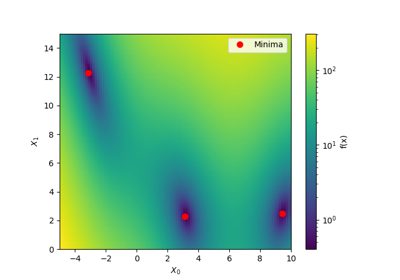
skopt.plots.plot_evaluations(result, bins=20, dimensions=None)[source][source]¶ Visualize the order in which points where sampled.
The scatter plot matrix shows at which points in the search space and in which order samples were evaluated. Pairwise scatter plots are shown on the off-diagonal for each dimension of the search space. The order in which samples were evaluated is encoded in each point’s color. The diagonal shows a histogram of sampled values for each dimension. A red point indicates the found minimum.
- Parameters
- result
OptimizeResult The result for which to create the scatter plot matrix.
- binsint, bins=20
Number of bins to use for histograms on the diagonal.
- dimensionslist of str, default=None
Labels of the dimension variables.
Nonedefaults tospace.dimensions[i].name, or if alsoNoneto['X_0', 'X_1', ..].
- result
- Returns
- ax
Axes The matplotlib axes.
- ax