skopt.plots.plot_convergence
-
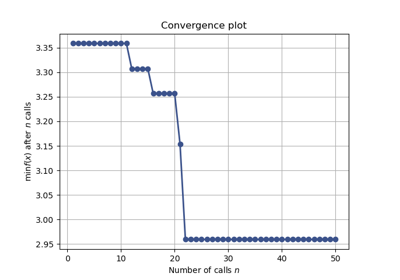
skopt.plots.plot_convergence(*args, **kwargs)[source][source]¶ Plot one or several convergence traces.
- Parameters
- args[i]
OptimizeResult, list ofOptimizeResult, or tuple The result(s) for which to plot the convergence trace.
if
OptimizeResult, then draw the corresponding single trace;if list of
OptimizeResult, then draw the corresponding convergence traces in transparency, along with the average convergence trace;if tuple, then
args[i][0]should be a string label andargs[i][1]anOptimizeResultor a list ofOptimizeResult.
- ax
Axes, optional The matplotlib axes on which to draw the plot, or
Noneto create a new one.- true_minimumfloat, optional
The true minimum value of the function, if known.
- yscaleNone or string, optional
The scale for the y-axis.
- args[i]
- Returns
- ax
Axes The matplotlib axes.
- ax