skopt.plots.plot_histogram
-
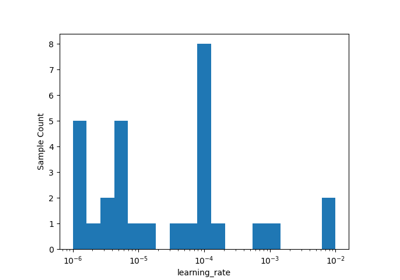
skopt.plots.plot_histogram(result, dimension_identifier, bins=20, rotate_labels=0, ax=None)[source][source]¶ Create and return a Matplotlib figure with a histogram of the samples from the optimization results, for a given dimension of the search-space.
- Parameters
- result
OptimizeResult The optimization results e.g. from calling
gp_minimize().- dimension_identifierstr or int
Name or index of a dimension in the search-space.
- binsint, bins=20
Number of bins in the histogram.
- rotate_labelsint, rotate_labels=0
Degree to rotate category-names on the x-axis. Only used for Categorical dimensions.
- result
- Returns
- ax
Matplotlib.Axes The Matplotlib Axes-object.
- ax